The One Free Variable
In KV-bound serving, bytes per resident token shape both the memory ceiling and the attention-traffic floor — here is the model, the measurements, and the validation protocol.
Cross-stack · AMD MI350X + NVIDIA GB10 · SGLang · vLLM · TensorRT-LLM
Originally published on Medium.
Start with the regime, not the slogan
In long-context, high-concurrency LLM serving, the bottleneck can shift away from tensor-core arithmetic and toward memory capacity and data movement. Prefill and decode are different workloads: prefill exposes substantial parallelism, while decode advances one token at a time per request and often uses the GPU's compute units less efficiently.
Model weights remain resident in memory and are read during decode. The KV cache adds a second, per-request working set. It grows with every live token, remains resident for the life of the request, and is consulted by attention as generation continues. So the KV cache is simultaneously what fills memory and what must be moved on every decode step — that dual role is the hinge of the whole argument.
Within that regime, one software-visible quantity becomes unusually high leverage: the bytes stored per KV token, per layer, per serving rank. Call it b.
This argument concerns long-context, high-concurrency serving where the KV working set is a material capacity and bandwidth constraint — long contexts, high concurrency, agent fleets, or deployments already queuing, evicting, or running out of memory. It is not a claim that every model, batch size, accelerator, or serving stack is KV-bound.
The capacity identity
For R requests that share the same resident context length T, the idealized KV footprint is:
Total KV memory is the per-token footprint times layers times resident context times concurrency.
b bytes/token/layer/rank · L layers · T resident context · R concurrent requests
Production traffic rarely has equal-length requests, so the more general form sums resident tokens across live requests:
Replace T·R with the sum of resident tokens across live requests.
The actual allocation is larger or differently shaped, because serving systems add block rounding, allocator metadata, reserved workspace, fragmentation, and other fixed overhead:
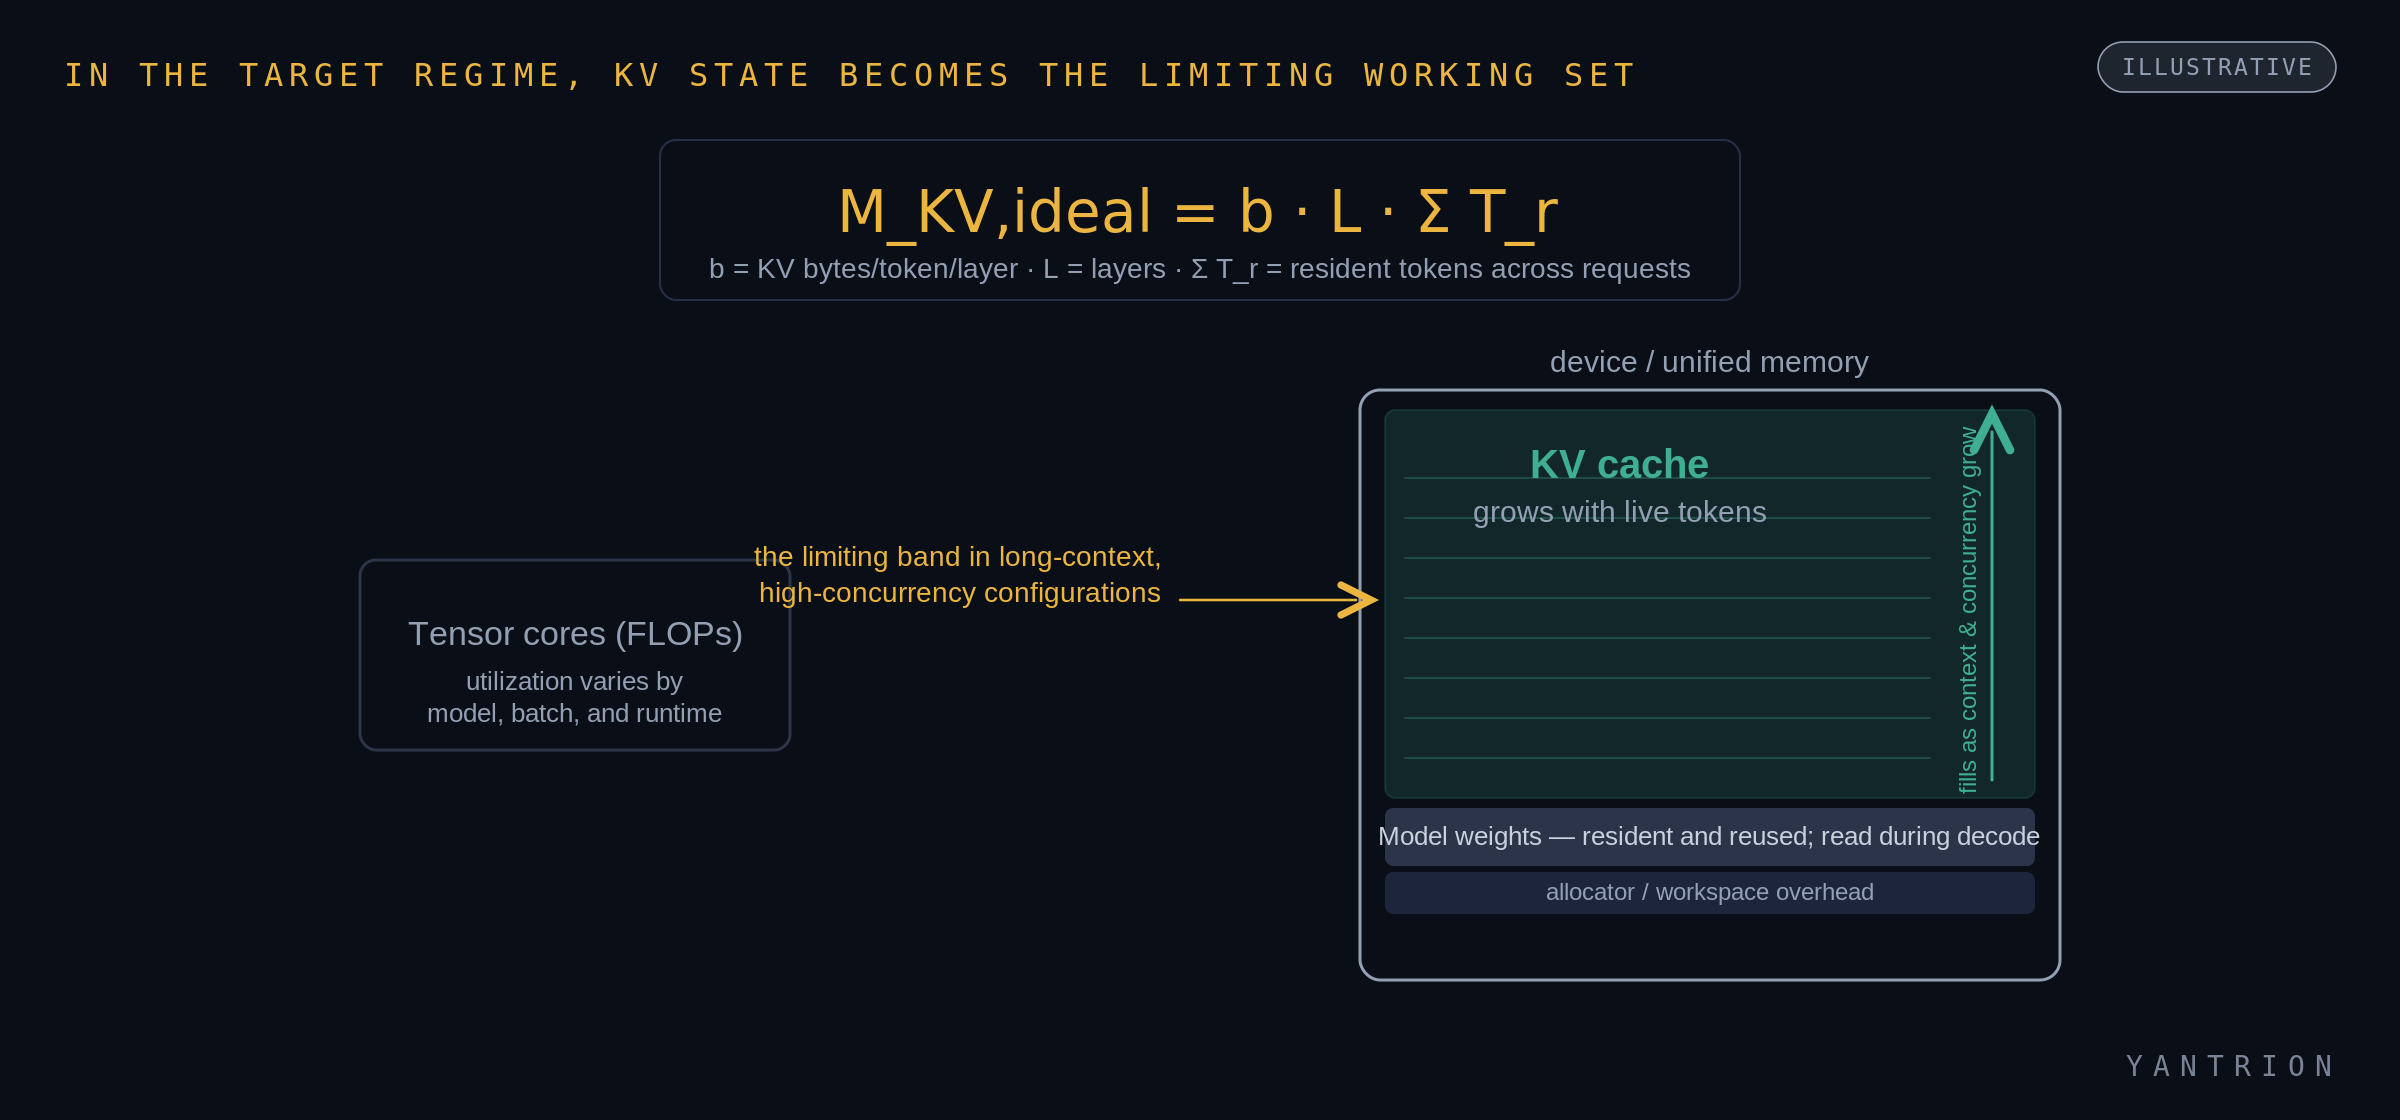
This identity exposes the business pressure. Products want longer contexts and more simultaneous sessions, and those two dimensions enter as a product. Double the mean resident context and double the number of live requests, and the ideal KV demand grows by roughly four times — multiplicatively, in exactly the directions a roadmap wants to scale.
b is not literally the only system lever. Model architecture, grouped-query attention, tensor parallelism, prefix sharing, paging, scheduling, context policies, and workload shape all matter. It is, however, the direct representation lever considered here: lowering it can preserve the selected model, retained context, and request concurrency while reducing the KV working set itself.
The latency connection — and its limit
Capacity is only half the argument. The same stored KV state also contributes to decode traffic. A more complete first-order model for a decode step is:
Step time tracks total bytes moved over bandwidth, plus runtime overhead (launches, communication, conversion).
Q traffic terms · BW bandwidth · t runtime terms
In a configuration where the KV term is material, lowering b relieves two pressures at once:
- Resident capacity: fewer bytes are needed for each live token.
- Attention traffic: fewer KV bytes need to move through the memory system.
That does not guarantee lower end-to-end TPOT. A smaller representation can add conversion work, or expose launch and scheduling overhead that was previously hidden. The realized latency result must therefore be measured. We use:
A value below 1 is faster than stock; 1 is parity; above 1 is an overhead.
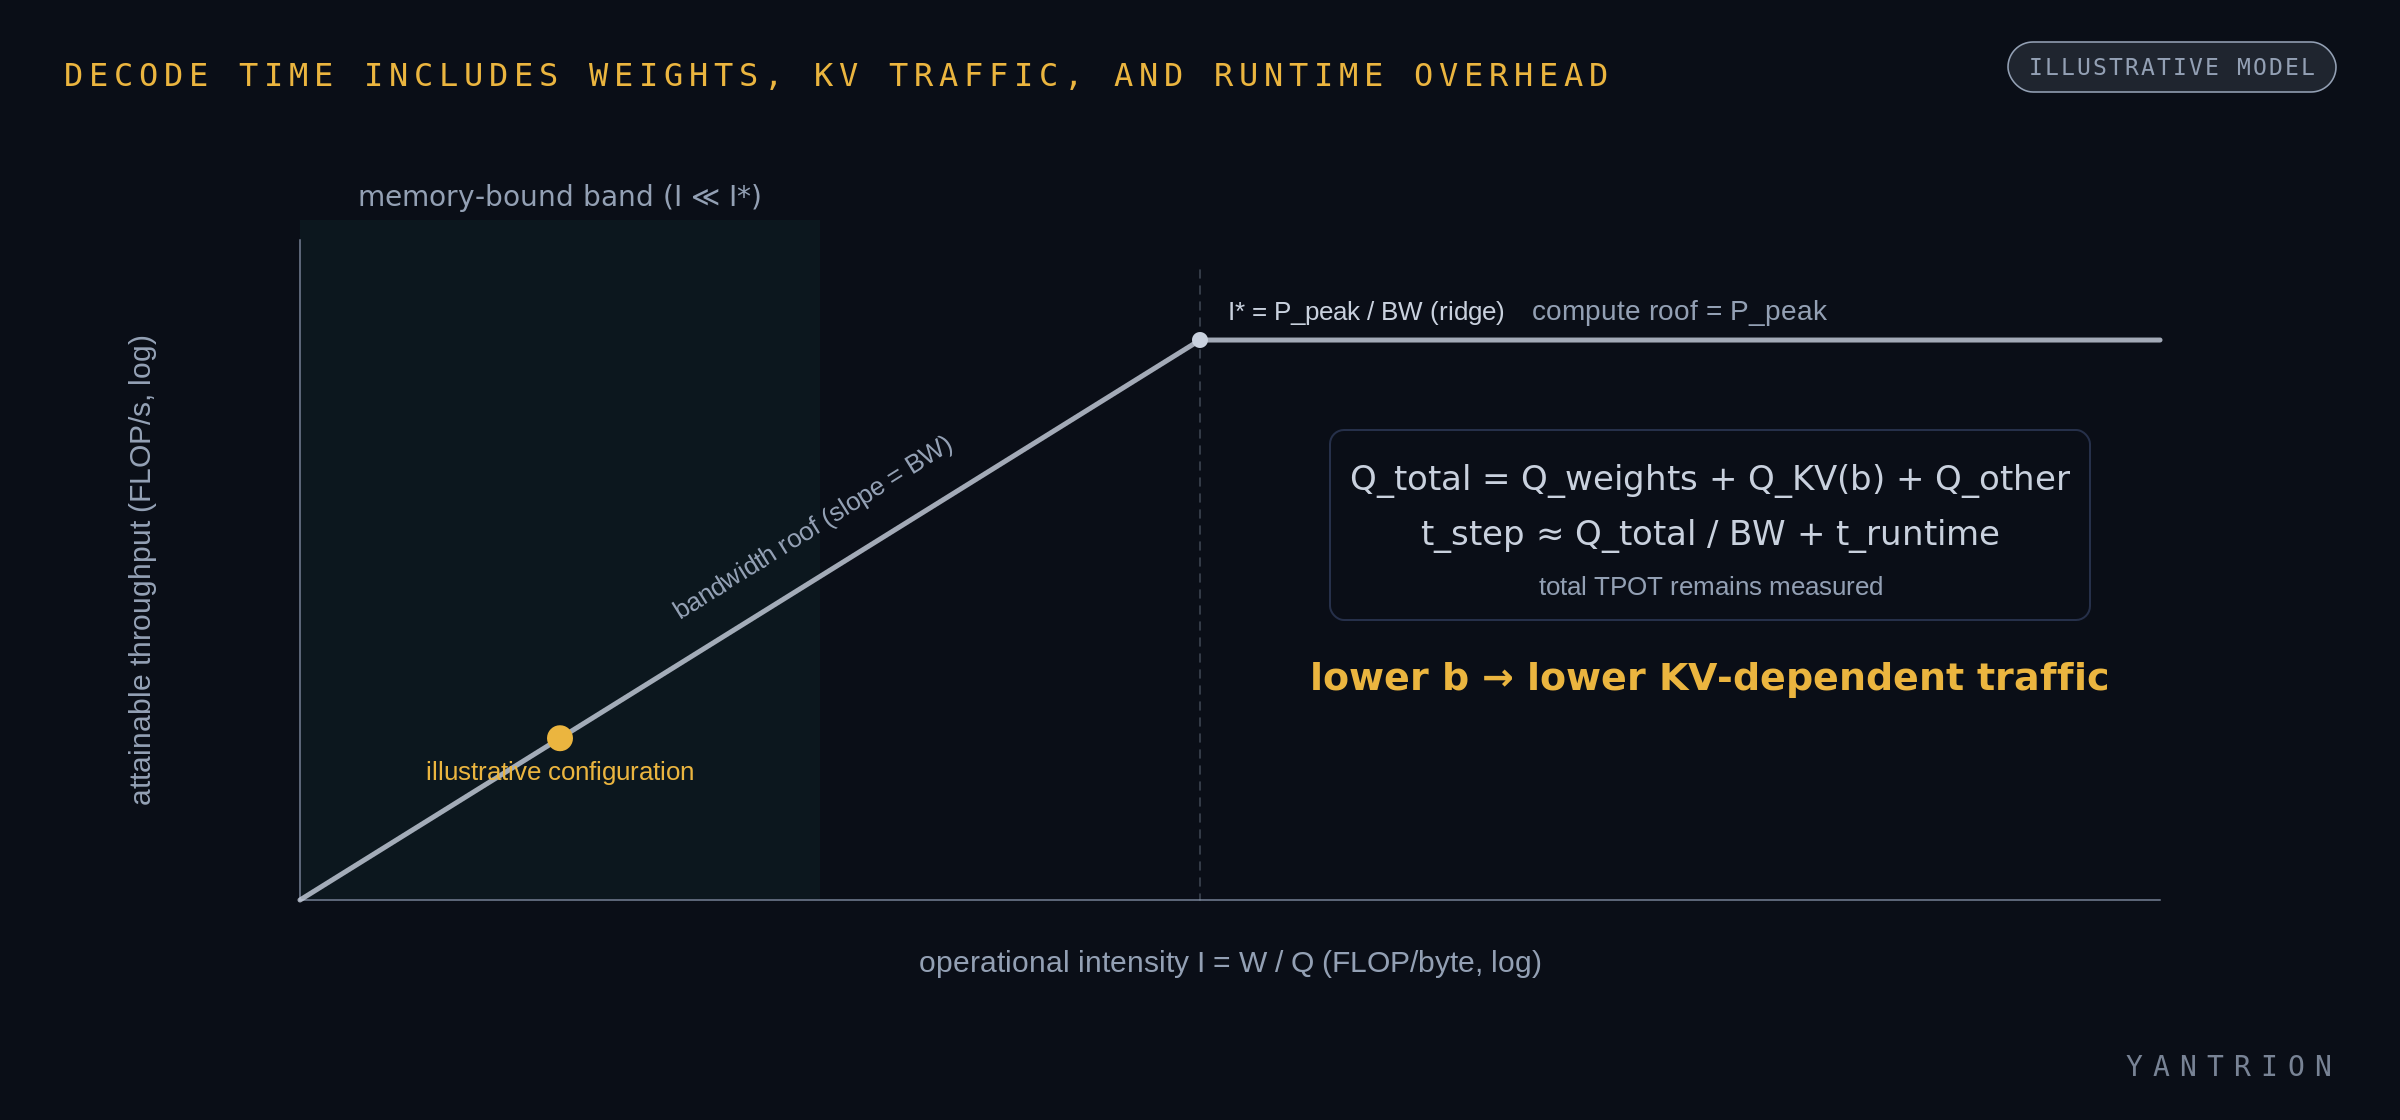
A lower KV footprint creates room to improve both resident capacity and KV-related decode traffic. The runtime decides how much of that theoretical advantage becomes measured latency or throughput.
Why common optimizations are complementary
Weight quantization (MXFP4, INT4, and friends) reduces the memory occupied by model parameters and can reduce weight traffic. It does not change the bytes stored per KV token, but it can free memory for a larger KV pool. Weight and KV techniques compose: one shrinks the model, the other shrinks the per-token cache.
Paged allocation and prefix sharing reduce fragmentation or duplicated state — they improve how efficiently the pool is used, rather than changing the representation size of each token. Windowing and eviction reduce retained context, lowering memory demand by changing what the model remembers, which may be acceptable for some products and unacceptable for others.
The specific target here is different: reduce the effective b while preserving the chosen model and retained context, then prove that the runtime and task quality remain acceptable.
What Yantrion claims to change
Yantrion is an inference-time serving layer that lowers the effective KV bytes per token. It is delivered as algorithm-aware optimized kernels and serving-stack integrations, and it does not retrain or modify the model weights.
This piece is deliberately empirical. It is written to be judged by what an operator can reproduce on their own hardware, not by a description of the method — so the entire case rests on quantities anyone can inspect:
- the stock and modified KV pool reported by the same serving engine;
- TPOT under the same model, workload, and runtime configuration;
- downstream task quality under a paired evaluation protocol;
- an off-path comparison that restores the unmodified server behavior;
- reproducibility across specified stacks and hardware.
The measured fact we build on is the increase in resident-token capacity under a matched KV-memory budget. Read through the capacity identity above — and after fixed overhead is accounted for — that increase corresponds to a lower effective per-token KV footprint. How that footprint is achieved does not enter the argument; the result is carried entirely by the measurements.
The results, by stack and test
The measurement set is published as a table by stack and test rather than a blended range. A row is not always a single operating point: the capacity columns and the TPOT column are, in general, separate tests on that stack — sometimes at different serving configurations — not one co-measured configuration. Compare stock and modified values within the capacity test, and read τ as a separate TPOT measurement on the same stack.
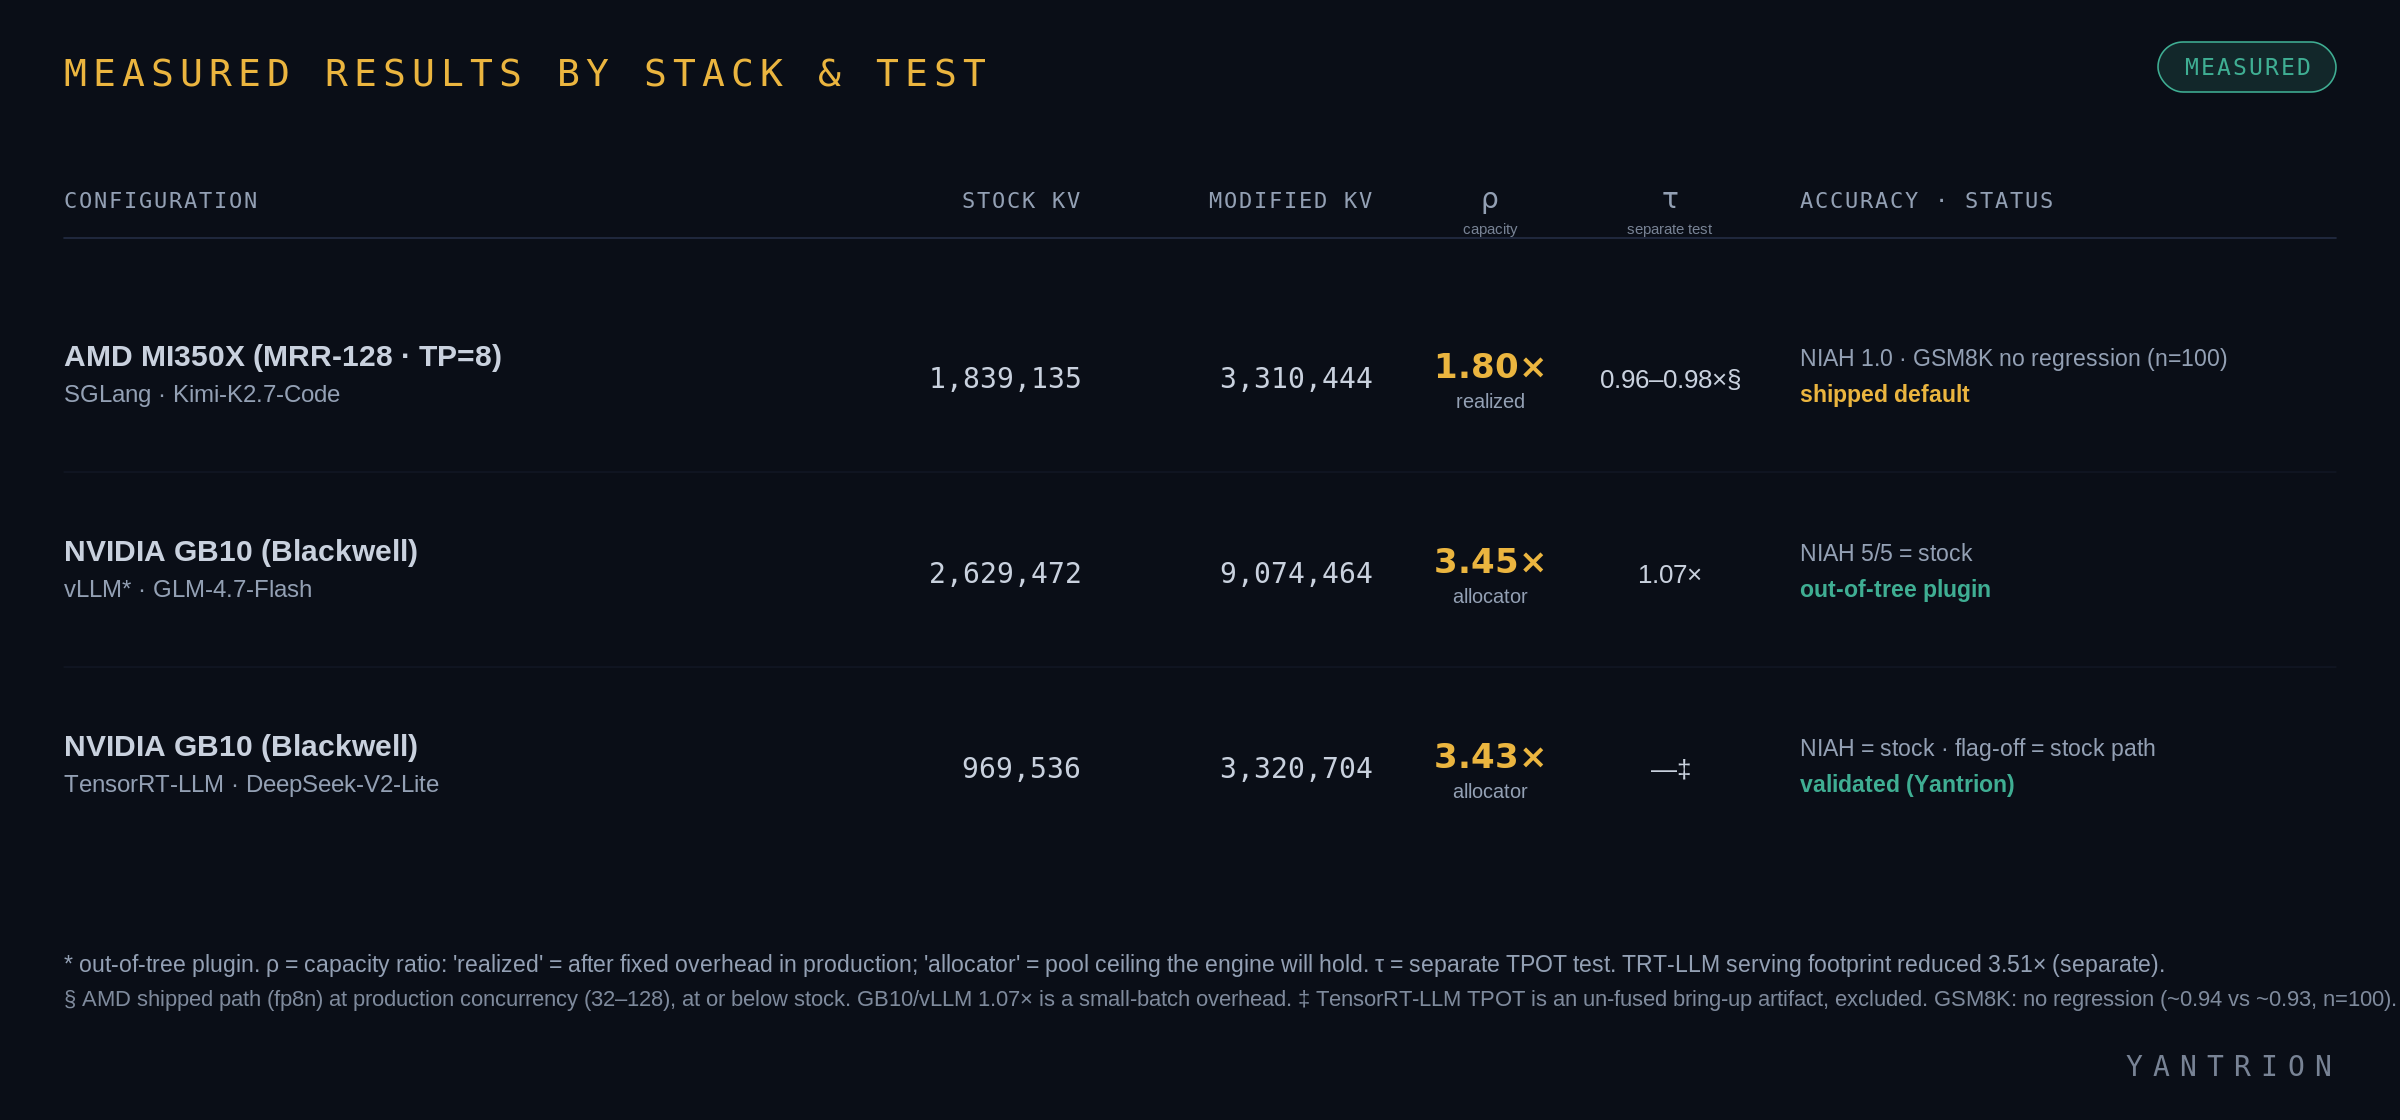
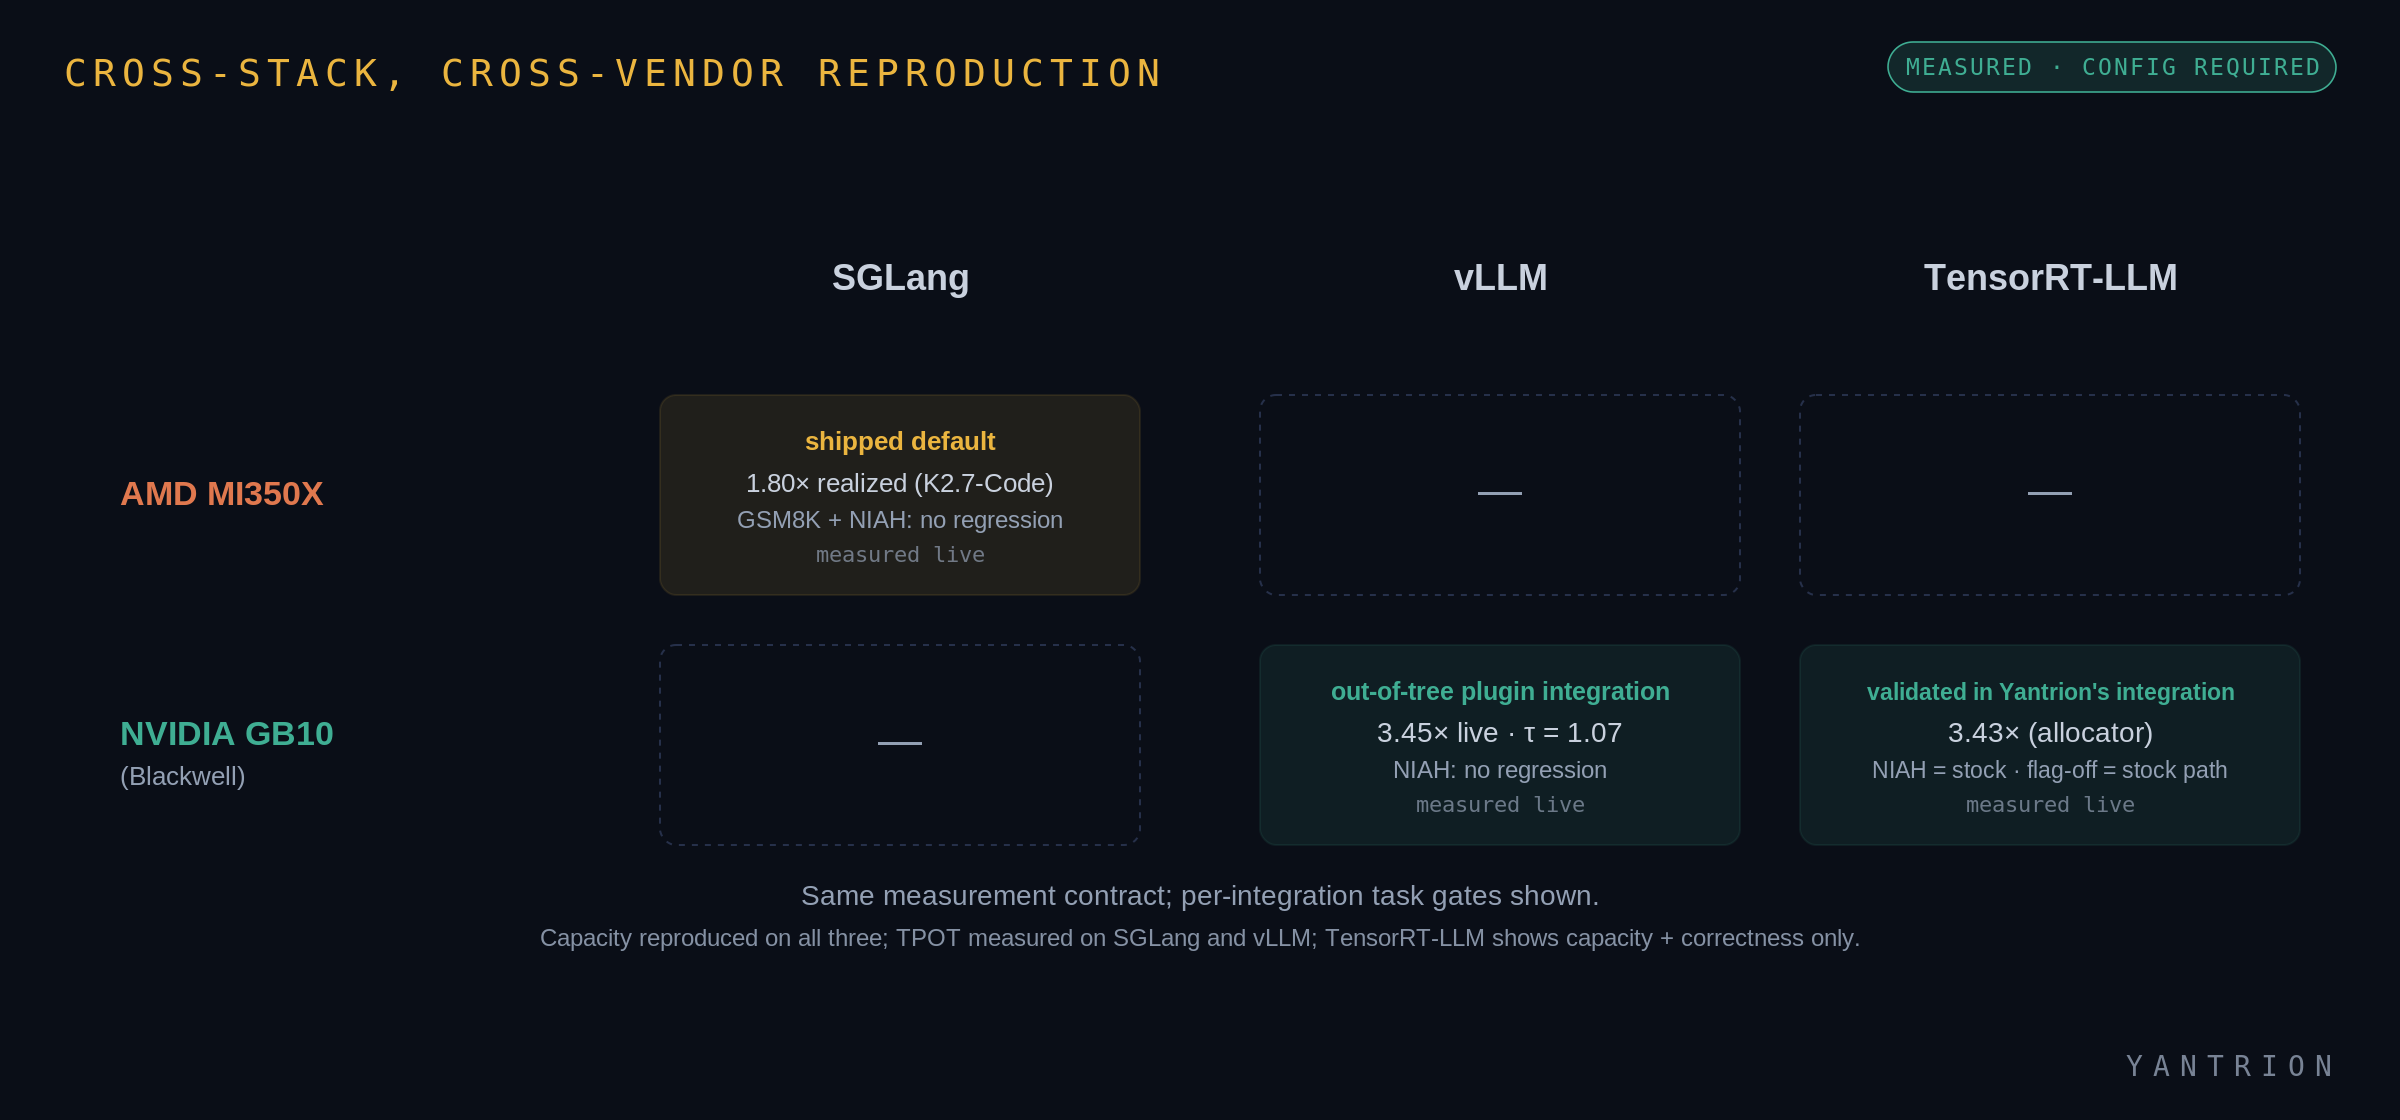
The τ values are TPOT ratios against unmodified stock, and they are not uniform. On the shipped AMD/SGLang path, at the high concurrency this serving targets (32–128 concurrent requests), TPOT is at or slightly below stock (τ ≈ 0.96–0.98×) — the 1.80× capacity gain carries no latency penalty in that regime. GB10/vLLM carries a small ~7% small-batch overhead (τ ≈ 1.07×). The TensorRT-LLM path is still on bring-up — its measured TPOT is dominated by un-fused host loops rather than the codec, so we exclude it rather than headline it. Each row is a different model, so the rows show the lever reproducing across models and stacks, not a single-model sweep.
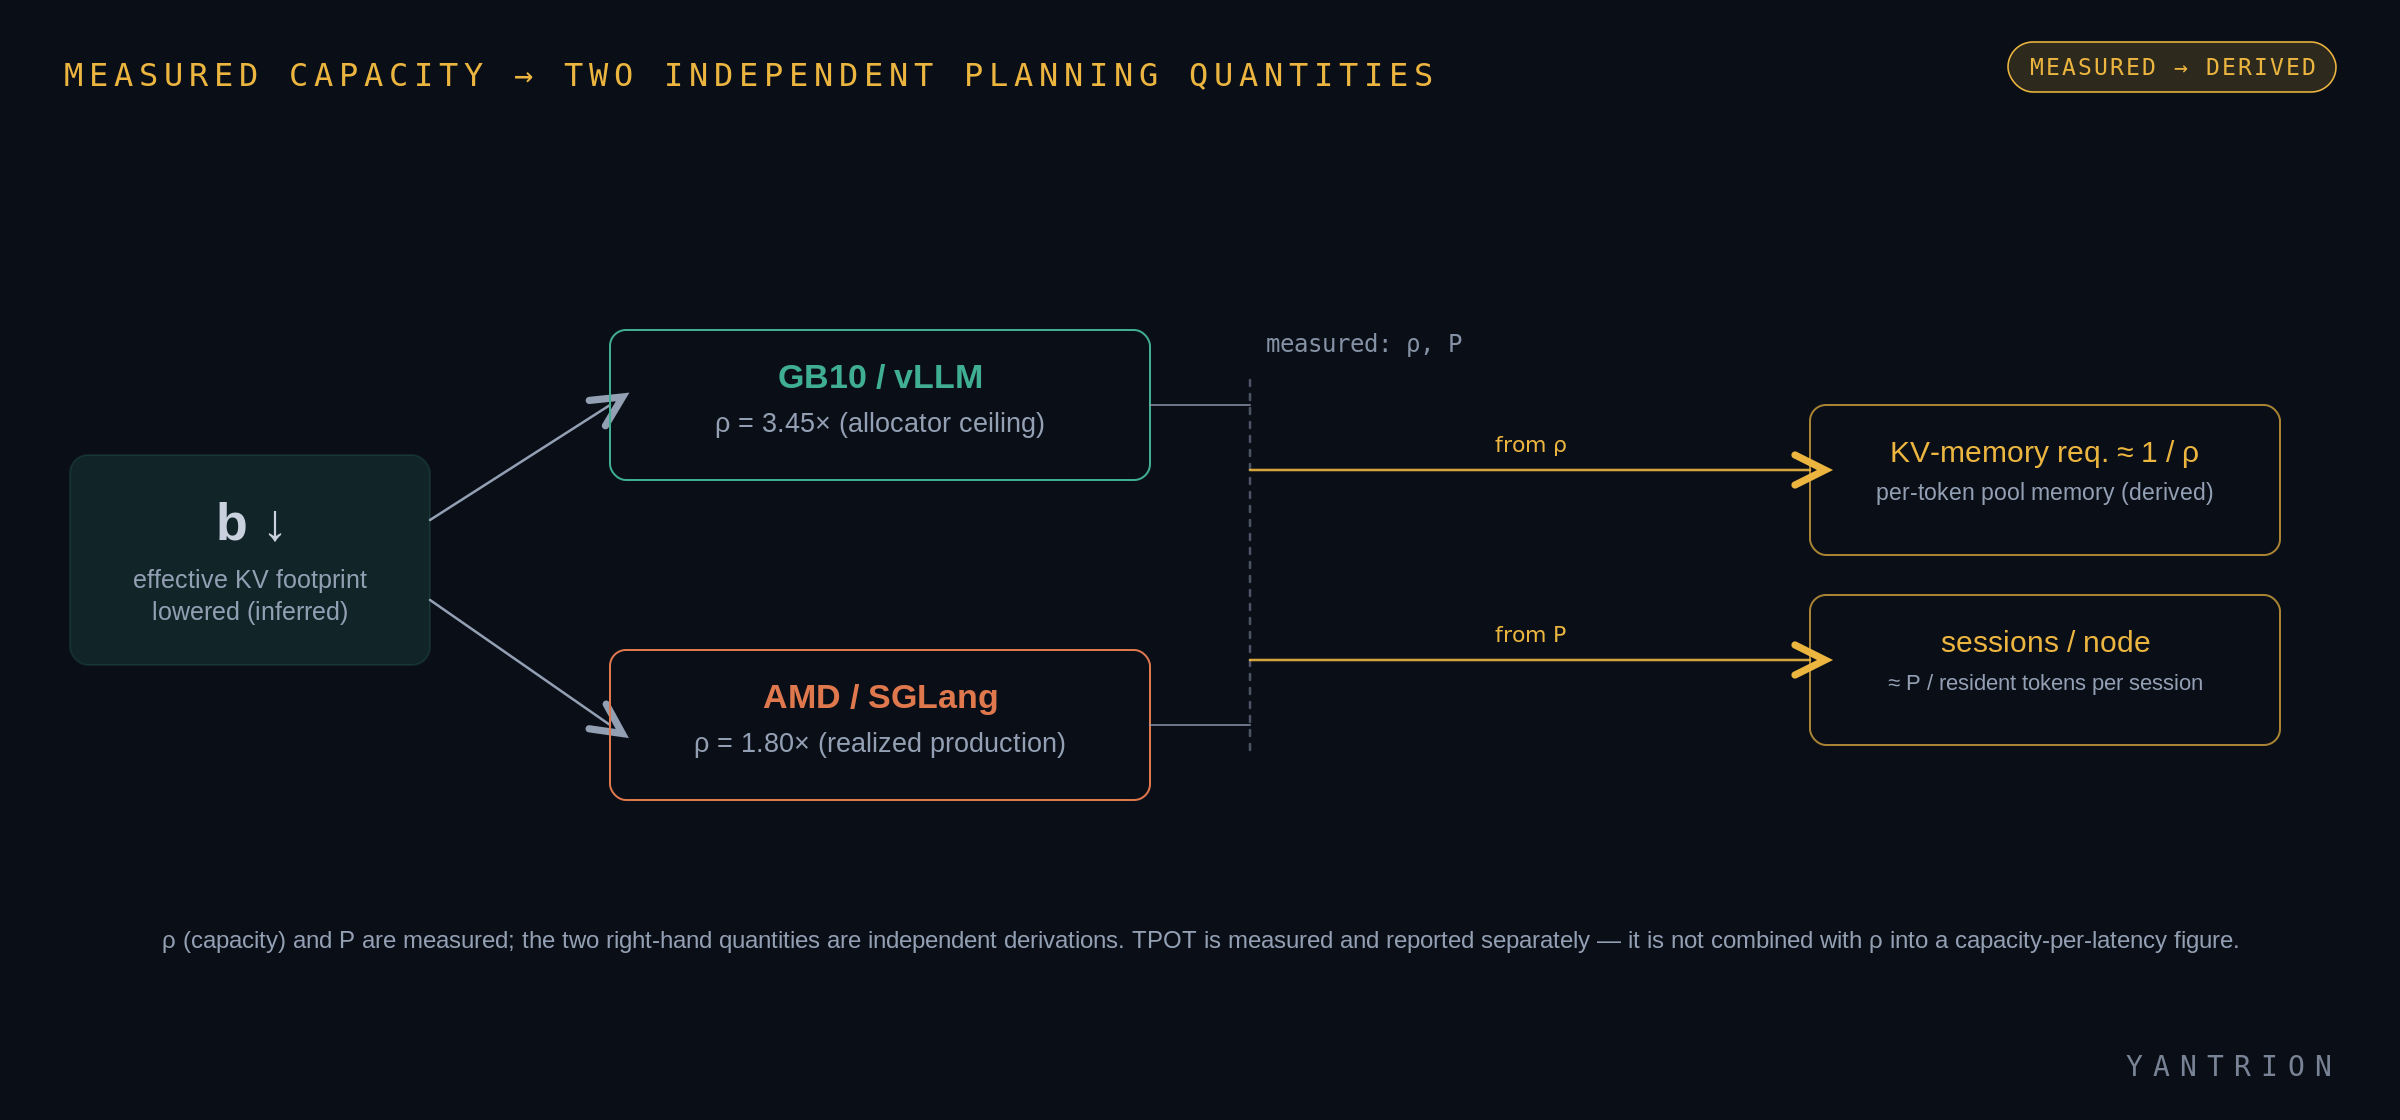
A note on the counts: the shipped AMD/SGLang result is 3,310,444 / 1,839,135 = 1.80× realized after fixed overhead. The GB10/vLLM allocator ratio is 9,074,464 / 2,629,472 = 3.45×, and TensorRT-LLM is 3,320,704 / 969,536 = 3.43× — both the live pool the engine's own KV manager will hold. These are counts an operator can read out of the serving engine, not headline figures.
The AMD/SGLang row is a realized production result; the two GB10 rows are allocator-capacity ceilings — the resident-token ratios the engine's own KV manager will hold. So across three stacks and two GPU vendors, the same lever yields a 1.80× realized production gain and 3.4–3.5× allocator ceilings — the gap is fixed overhead and box sharing, not a different lever. A conservative capacity plan sizes a budget against the 1.80×; the ceilings show the headroom on an unshared box.
Boundaries that travel with every headline
- The regime matters. The strongest fit is long-context, high-concurrency serving where KV capacity or traffic is material. A compute-bound or single-stream configuration may not realize the same benefit.
- The algebra transfers; the ratios do not. The identity and the traffic model carry across silicon, but every capacity ratio, TPOT ratio, and kernel speedup must be remeasured for the target model, stack, allocator, hardware, and workload.
- Allocator capacity is not end-to-end throughput. Both are valuable measurements, but they must be named separately.
- A KV-memory estimate is not a bill. The estimate 1/ρ is arithmetic on a measured ratio — not a total-cost-of-ownership result. We deliberately do not publish a ρ/τ capacity-per-latency figure; capacity and TPOT were not co-measured at one operating point.
- Hardware specifications must be exact. GB10's published unified-memory bandwidth is ~273 GB/s; recheck any roofline against that figure.
What can be derived — and what still needs to be measured
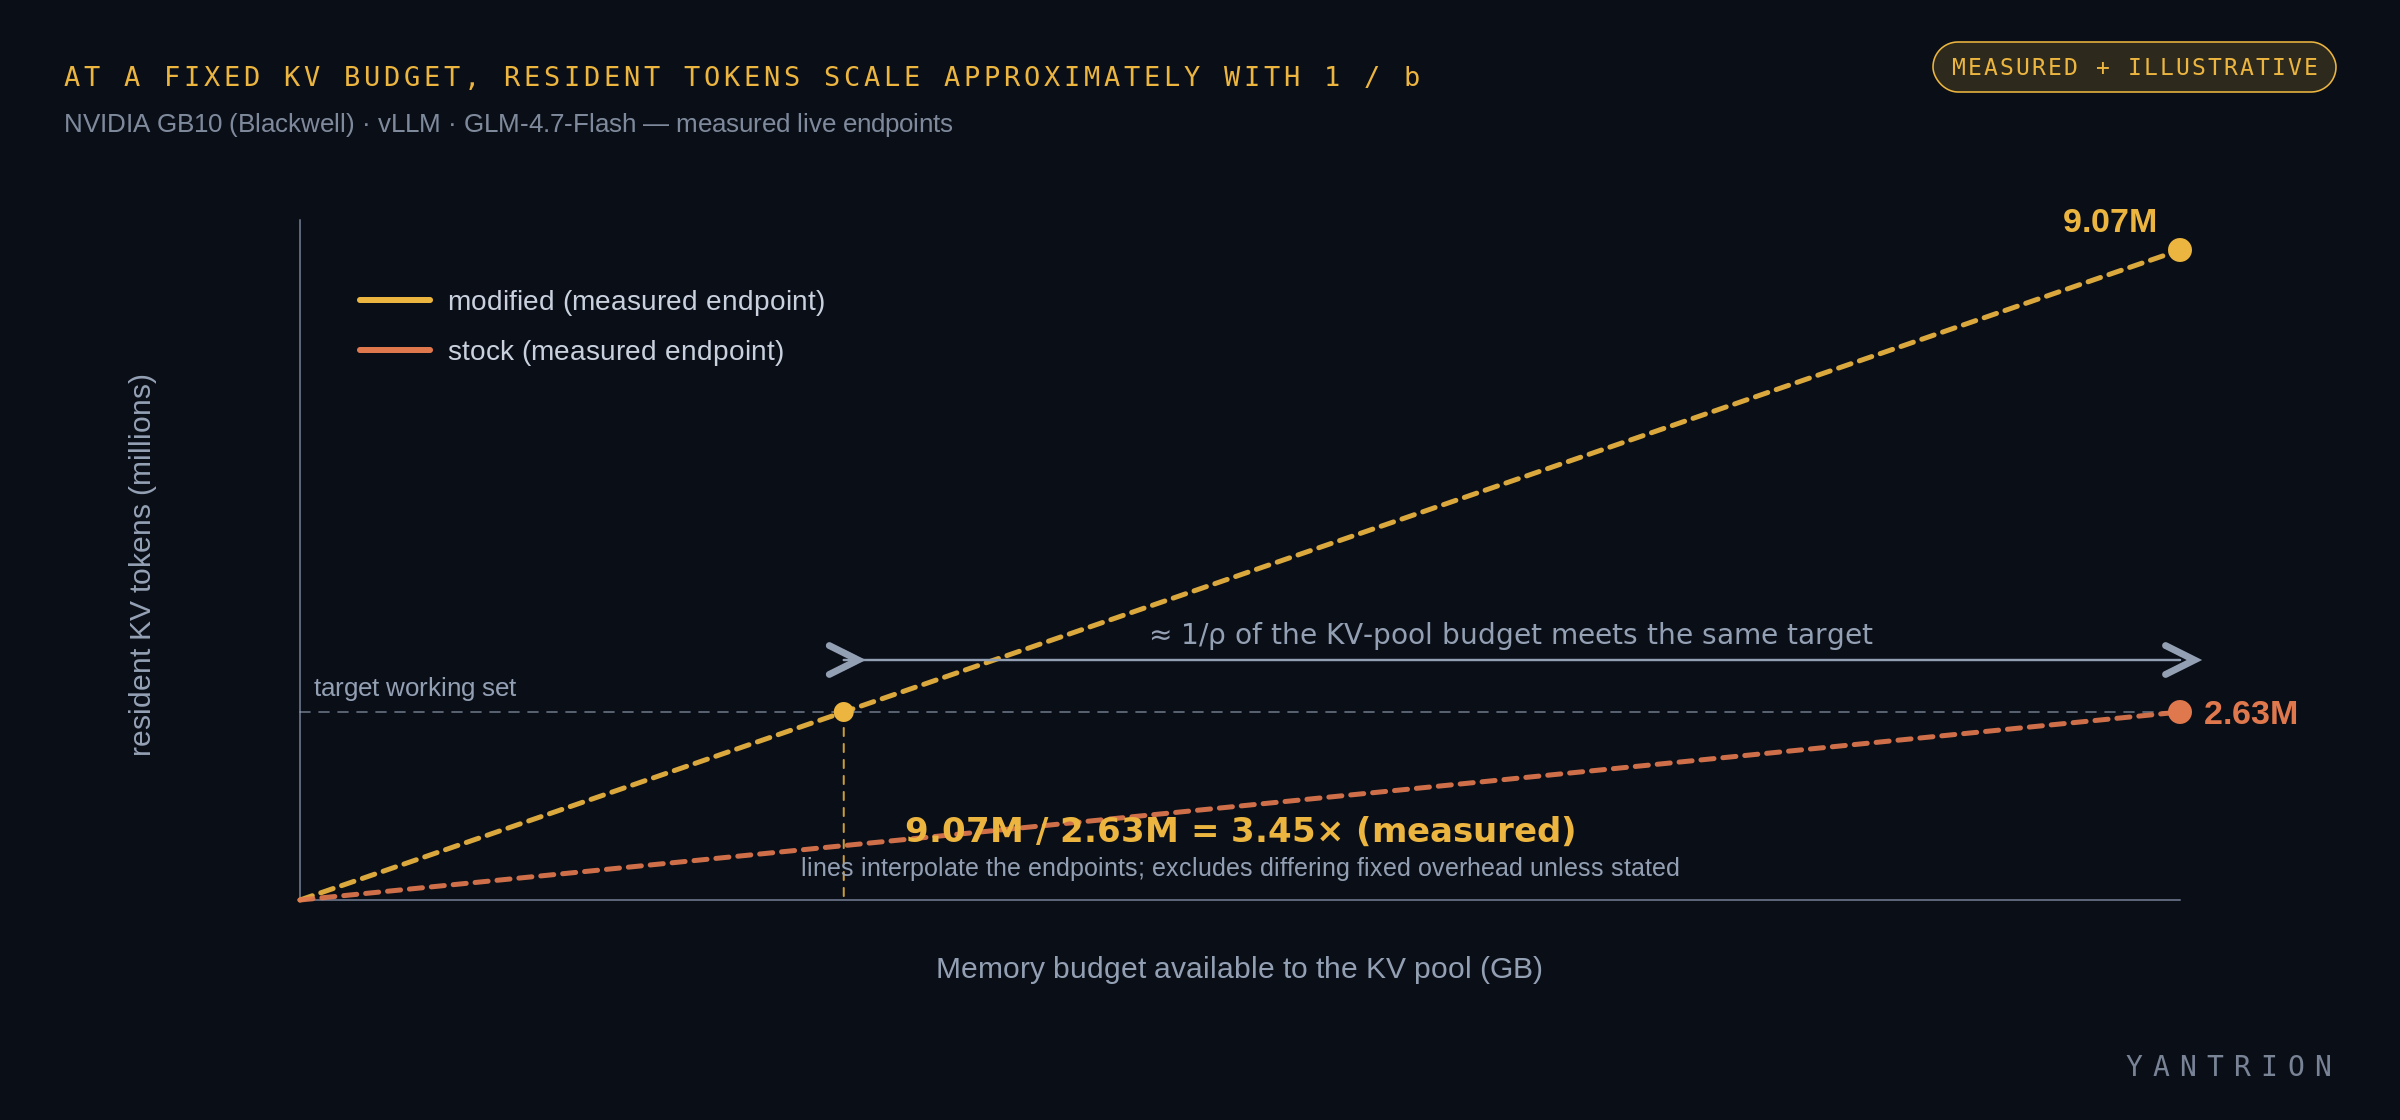
At fixed overhead, the ideal capacity ratio is:
A tempting next step is to divide the capacity ratio by the TPOT ratio to get a capacity-per-latency figure. We deliberately do not publish that number. The capacity and TPOT results here come from different operating points, so their quotient does not describe a single attainable configuration. A combined capacity-and-latency trade-off measured at one matched operating point remains to be run.
What can be derived are two independent planning quantities. First, 1/ρ is a useful estimate of the KV-resident-memory requirement for the same token pool — not automatically the total dollar-cost ratio of a production service, which also includes the model footprint, CPUs, networking, power, fixed fleet granularity, utilization, and the latency target. Second, a related planning figure is the resident-session density:
P is the resident KV-pool tokens per node.
In the KV-bound regime, multiplying the resident pool by ρ lets a node hold roughly ρ× more live sessions of a given context length before it must evict and re-process — the point where memory-bound serving latency cliffs rather than gracefully degrades.
Correctness is the gate, not the decoration
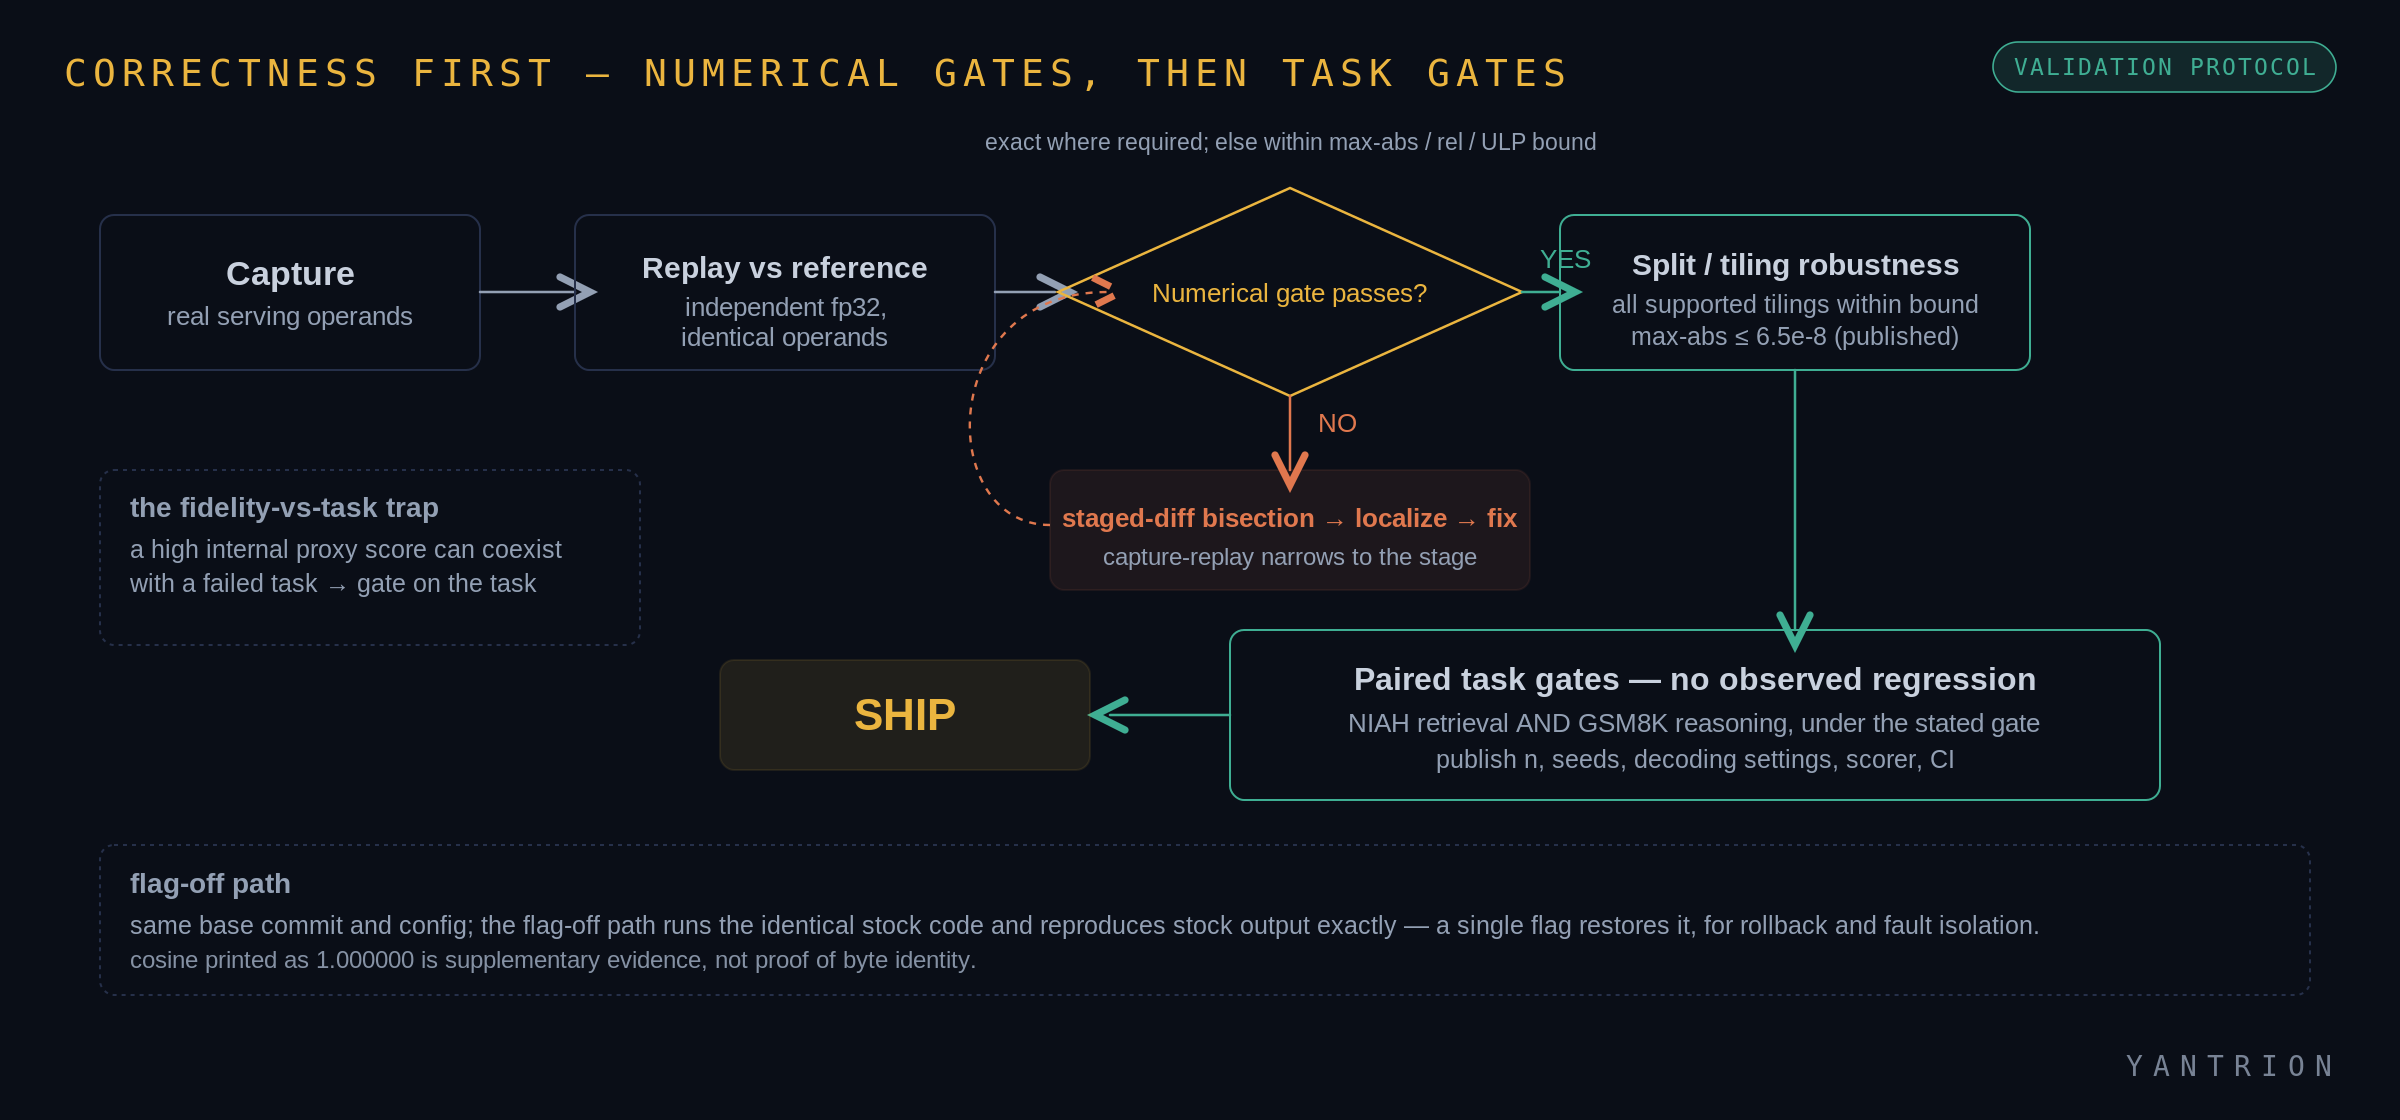
A serving-layer optimization can look successful in a latency chart while quietly changing an answer. A corrupted cache passes every timing check and is still wrong. That is the failure mode the validation protocol is designed to catch, so the governing rule is stated as a principle:
Gate on downstream task behavior before using latency as evidence of success.
The public protocol has four layers. First, exact-path checks: when the flag is off, no modified code executes — the server runs the identical stock code path and reproduces stock output exactly. Second, numerical error checks: compare every supported kernel shape against an independent reference; in the reductions here, max-abs ≤ 6.5×10⁻⁸ across supported tilings. Third, paired task gates: long-context retrieval (NIAH) and multi-step reasoning (GSM8K). Fourth, capture-and-replay: when a metric regresses, capture the real operands, replay offline against the reference, and staged-diff until the first divergence localizes.
Across the disclosed runs, no task regression was observed under the stated gates: NIAH is at stock (1.0 on AMD/SGLang; 5/5 = stock on GB10/vLLM), and the GSM8K point estimate was ~0.94 for Yantrion versus approximately 0.93 for stock (n=100). We treat this as parity and do not claim an improvement in reasoning; a formal non-inferiority result is not asserted here.
Cross-stack and cross-vendor reproduction
The resident-capacity effect reproduced across three serving integrations and two GPU vendors: SGLang on AMD MI350X, and vLLM plus TensorRT-LLM on NVIDIA GB10. TPOT was measured on the SGLang and vLLM rows; the TensorRT-LLM evidence currently covers capacity and correctness (its flag-off path reproduces stock output exactly).
Different allocators, kernel paths, and integration surfaces reduce the chance that a result is an artifact of one serving engine. The accurate term is cross-stack, cross-vendor reproduction; independent replication is reserved for experiments run and controlled by a separate organization. For vLLM, the integration is packaged through the project's documented plugin entry-point mechanism — a supported path for out-of-tree code, not a runtime patch. The TensorRT-LLM row (on DeepSeek-V2-Lite) is validated in Yantrion's integration; its flag-off path runs the identical stock code and reproduces stock output exactly.
The stance
The strongest version of this story is not that one equation proves a product result. It is that the equation identifies a high-leverage variable, the serving engine exposes that variable, and a disciplined experiment can measure what happens when it changes. The case is carried by those measurements, not by any account of the method.
The useful question for an operator is simple: under the same model, stack, workload, and task gate, how many resident KV tokens fit, what happens to TPOT, and do the answers remain correct? Every quantity here is one an operator can read out of the same serving engine — the stock and modified pool, the TPOT ratio, the task-gate scores — so the result is meant to stand on measurements you could take yourself, not on taking Yantrion's word for it.
Prove it on your workload.
Flag off is your exact current server; flag on is the same server with far more headroom. Measure it on your own stack.
contact@yantrion.com